
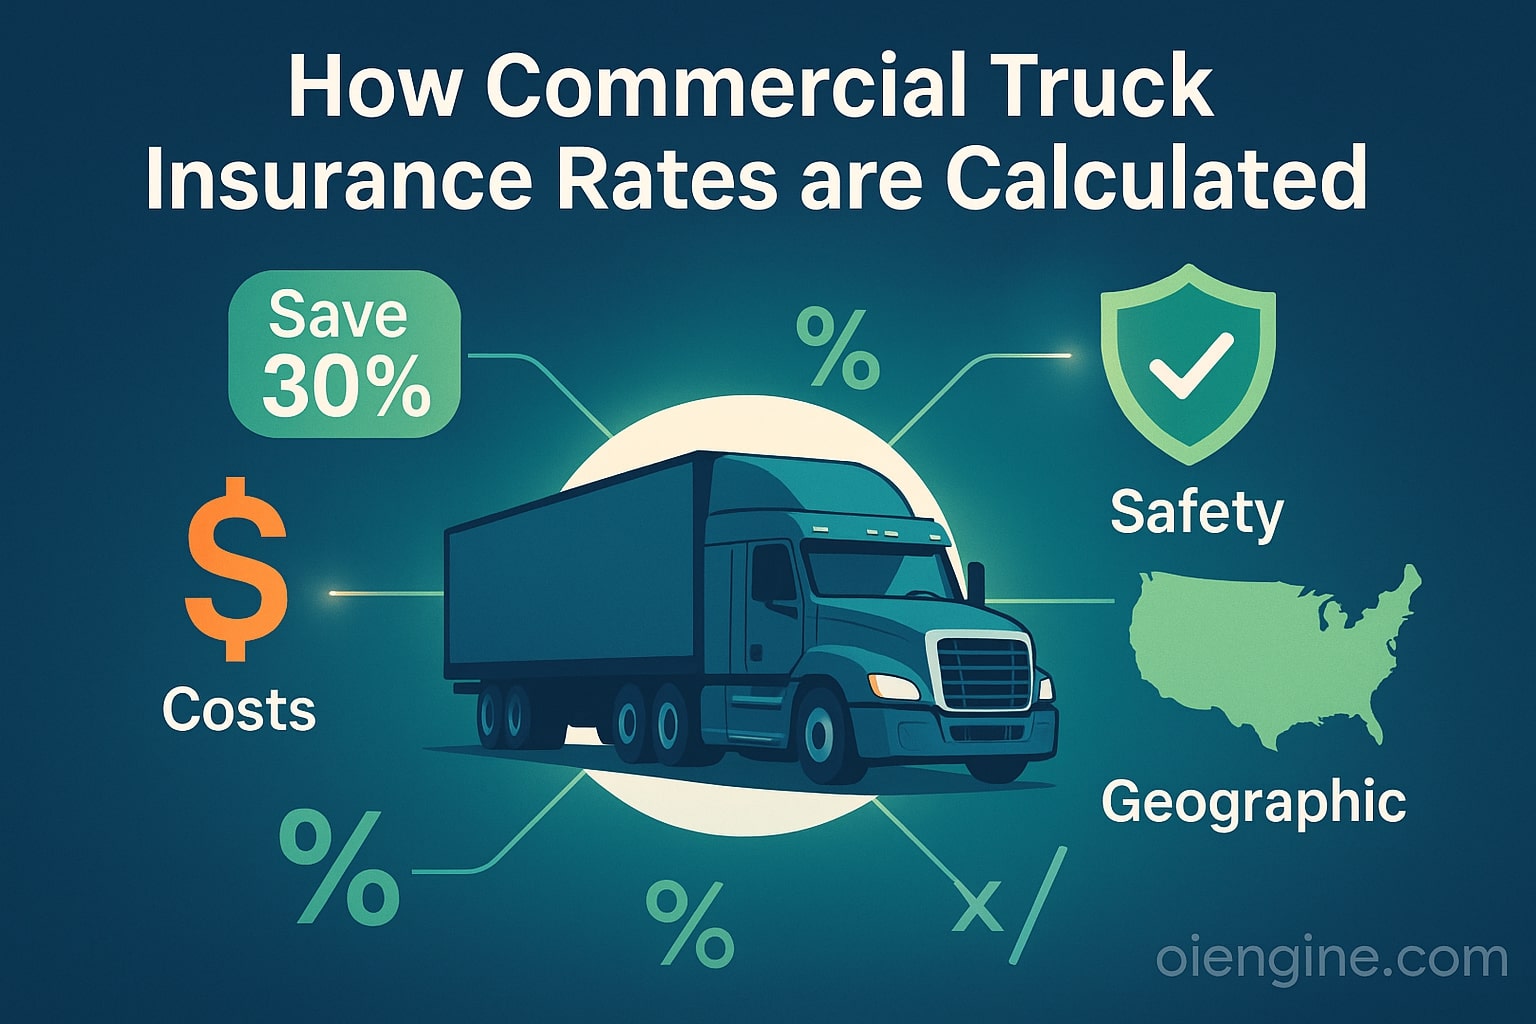
The commercial trucking industry faces a stark reality: 66% of truckers identify insurance costs as their second-biggest operational challenge. With over 500,000 large truck accidents occurring annually in the United States, understanding how insurers calculate your premiums has never been more critical.
Commercial truck insurance rates are calculated through sophisticated risk assessment algorithms that evaluate more than 15 distinct factors. These calculations determine whether you’ll pay $3,000 or $22,000 annually for coverage. The good news? Understanding this process can help you save thousands on your trucking insurance rates.
This comprehensive guide reveals exactly how insurance companies determine your premiums, which factors carry the most weight, and proven strategies to reduce your costs. We’ll decode the actual calculation methods, explore real-world pricing data, and provide actionable insights that can immediately impact your bottom line.
Table of Contents
- The Insurance Rate Calculation Formula Explained
- Primary Factors That Determine Your Rates
- Secondary Factors Affecting Premium Calculations
- Real Commercial Truck Insurance Cost Breakdown 2026
- Coverage Types and Their Impact on Rates
- Federal and State Regulations Affecting Rates
- How Insurance Companies Evaluate Risk?
- Proven Strategies to Lower Your Insurance Rates
- Common Mistakes That Increase Your Rates
- Insurance Shopping Best Practices
- Future Trends in Commercial Truck Insurance Pricing
- Frequently Asked Questions
- Why is commercial truck insurance so expensive compared to regular auto insurance?
- How often do commercial truck insurance rates change?
- Can I reduce rates by limiting my operating radius?
- Does the age of my truck significantly impact rates?
- What’s the difference between owner-operator and fleet insurance rates?
- Conclusion
The Insurance Rate Calculation Formula Explained
Basic Risk Assessment Model
Insurance companies use a fundamental formula: Base Rate × Risk Multipliers = Your Premium. The base rate represents the average cost for your truck classification in your operating area. Risk multipliers adjust this rate based on your specific circumstances.
Each risk factor receives a numerical score between 0.5 and 3.0. A score below 1.0 reduces your rate, while scores above 1.0 increase it. The final premium emerges from multiplying all these factors together.
For example, a clean driving record might earn a 0.85 multiplier, while hauling hazardous materials could add a 2.5 multiplier. These multipliers compound, significantly impacting your final commercial truck insurance cost.
How Actuarial Science Drives Pricing?
Actuaries analyze millions of data points to predict claim probability and severity. They examine historical loss data, industry trends, and emerging risks to establish baseline rates. This scientific approach ensures insurance companies collect enough premiums to cover claims while remaining competitive.
The process involves complex statistical modeling that considers correlation between various risk factors. Actuaries update these models quarterly, incorporating new loss data and adjusting for inflation, legal changes, and market conditions.
Modern actuarial models also factor in predictive analytics, using artificial intelligence to identify risk patterns human analysts might miss. This evolution in pricing methodology explains why rates can vary dramatically between seemingly similar operations.
The Role of Loss Ratios in Premium Setting
Loss ratios directly influence how trucking insurance companies set rates for entire market segments. A loss ratio represents claims paid divided by premiums collected. Target ratios typically range from 60-65% for profitable operations.
When specific segments show higher loss ratios, insurers adjust rates upward to maintain profitability. Conversely, segments with favorable loss ratios may see rate decreases. This dynamic pricing ensures the insurance pool remains sustainable.
Individual operators benefit from understanding this concept. Belonging to lower-risk segments or demonstrating superior safety practices can position you within more favorable rating tiers.
Primary Factors That Determine Your Rates
USDOT Authority Status (Own Authority vs. Leased)
Your operating authority fundamentally shapes your insurance costs. Owner-operators with their own authority typically pay $14,000-$22,000 annually, while those leased to carriers pay just $3,600-$5,000. This dramatic difference reflects the risk distribution between parties.
Leased operators benefit from their carrier’s primary liability coverage during dispatch. They only need non-trucking liability for personal use, significantly reducing costs. However, this arrangement limits operational flexibility and potential earnings.
Independent authority holders assume full liability for all operations. While this increases truck insurance premiums, it provides complete control over freight selection, routes, and business decisions. The trade-off between cost and autonomy remains a crucial business decision.
Vehicle Type and Specifications
Your truck’s specifications directly impact insurance calculations. Heavier vehicles cause more damage in accidents, leading to higher premiums. A standard semi-truck costs more to insure than a box truck, even when hauling identical cargo.
Age plays a crucial role in rate determination. Newer trucks with advanced safety features like collision mitigation systems and lane departure warnings often qualify for reduced rates. However, their higher replacement value partially offsets these savings.
Insurance companies also consider specialized equipment. Refrigerated units, flatbeds with special tie-down systems, or trucks with hydraulic lifts face different risk profiles. Each modification affects your rate calculation.
Cargo Classification and Risk Level
The freight you haul represents one of the most significant rate factors. Standard dry goods might add a 1.0 multiplier, while electronics could bring a 1.5 multiplier. Hazardous materials can push multipliers above 3.0.
Federal regulations mandate specific coverage levels based on cargo type. Hazmat carriers must maintain $5,000,000 in liability coverage, compared to $750,000 for general freight. These requirements directly translate to higher base premiums.
Beyond regulatory minimums, insurers assess theft risk, damage potential, and cleanup costs. Hauling pharmaceuticals or high-value electronics triggers additional security requirements and corresponding rate adjustments.
Operating Radius and Geographic Zones
Your operational territory significantly influences rate calculations. Local operators typically see 20-30% lower rates than long-haul drivers. This reflects reduced exposure to varying road conditions, weather patterns, and unfamiliar routes.
Interstate operations face additional complexities. Different states maintain varying minimum coverage requirements and legal environments. Operating in litigation-friendly states or high-accident corridors increases your risk profile.
Urban versus rural operations also affect pricing. City driving involves more frequent stops, tighter spaces, and increased accident potential. Rural routes may feature challenging terrain but generally show lower accident frequency.
Driver Experience and Safety Records
Insurance companies scrutinize driving histories extensively. A single accident can increase rates by 20-40%, while multiple violations might make coverage unavailable. Clean records spanning 3-5 years qualify for the best rates.
Experience matters beyond violation history. Drivers with 10+ years of commercial experience typically see 15-25% lower rates than those with minimal experience. CDL endorsements and safety certifications provide additional discounts.
Companies increasingly value ongoing education. Drivers completing defensive driving courses or safety programs through occupational accident insurance providers often qualify for immediate rate reductions.
Secondary Factors Affecting Premium Calculations
Business Age and Industry Experience
Established trucking businesses enjoy significant rate advantages. Companies operating successfully for five or more years demonstrate stability and risk management capability. New ventures face 30-50% higher rates during their first two years.
This premium reflects statistical reality: newer operations show higher claim frequency. They lack established safety protocols, experienced management, and proven operational procedures. Insurers price this uncertainty into initial quotes.
Building a positive track record requires patience and diligence. Maintaining continuous coverage, avoiding gaps, and demonstrating steady growth all contribute to improved rates over time.
Fleet Size and Management Systems
Fleet operations introduce economies of scale to insurance pricing. While total premiums increase with truck count, per-unit costs typically decrease. Ten-truck fleets often pay 10-15% less per vehicle than single-truck operations.
Modern fleet management systems provide additional savings opportunities. GPS tracking, electronic logging devices, and maintenance management software demonstrate professional operations. Insurers reward this systematic approach with reduced rates.
Driver management practices also influence fleet rates. Companies with formal hiring procedures, ongoing training programs, and clear safety policies receive favorable consideration during underwriting.
Safety Technology and Equipment
Advanced safety technology significantly impacts modern rate calculations. Automatic emergency braking systems can reduce rates by 5-10%. Dashboard cameras provide even greater savings, sometimes reaching 15% discounts.
| Safety Technology | Typical Rate Reduction |
| Forward Collision Warning | 5-8% |
| Automatic Emergency Braking | 8-10% |
| Lane Departure Warning | 3-5% |
| Dashboard Cameras | 10-15% |
| Electronic Stability Control | 5-7% |
| Speed Limiters | 3-5% |
Insurers increasingly require or strongly incentivize technology adoption. The investment typically pays for itself through premium savings within 12-18 months.
Claims History and Loss Runs
Your claims history extends beyond simple accident records. Insurers analyze claim frequency, severity, and type. Three small claims might impact rates more than one moderate claim, as frequency suggests systemic issues.
Loss runs from previous insurers provide crucial underwriting data. These reports detail all claims, including those below deductible amounts. Patterns in these reports influence risk assessment and pricing decisions.
Time heals claims impact. Most insurers primarily consider claims within the past three years, with diminishing weight for older incidents. Strategic patience in shopping coverage can yield significant savings.
Credit Score Impact on Commercial Rates
Commercial credit scores increasingly influence trucking insurance rates. Strong business credit suggests financial stability and responsible management. Poor credit can increase premiums by 20-35%.
This correlation reflects actuarial findings linking credit scores to claim probability. Businesses maintaining strong credit typically demonstrate better overall risk management. They maintain equipment properly and retain quality drivers.
Improving business credit before insurance shopping can generate substantial savings. Even modest improvements in credit standing can reduce annual premiums by thousands of dollars.
Real Commercial Truck Insurance Cost Breakdown 2026
Average Costs by Coverage Type
Understanding typical costs helps establish realistic budget expectations. These averages represent national figures for standard operations:
| Coverage Type | Annual Cost Range | Monthly Average |
| Primary Liability | $9,000 – $15,000 | $750 – $1,250 |
| Physical Damage | $1,500 – $4,000 | $125 – $333 |
| Cargo Insurance | $400 – $1,200 | $33 – $100 |
| General Liability | $500 – $800 | $42 – $67 |
| Non-Trucking Liability | $350 – $480 | $29 – $40 |
| Workers’ Compensation | $3,000 – $5,000 | $250 – $417 |
| Umbrella Coverage | $5,000 – $7,000 | $417 – $583 |
These figures vary significantly based on individual risk factors. Owner-operators with excellent records might pay below these ranges, while high-risk operations could see double these amounts.
State-by-State Premium Variations
Geographic location creates dramatic cost differences. Mississippi offers the nation’s lowest rates, averaging $3,552 annually for local operations. Conversely, states like New York and California can see premiums exceeding $20,000.
These variations reflect different legal environments, accident rates, and regulatory requirements. States with higher minimum coverage mandates naturally see elevated base rates. Additionally, litigation trends and jury award histories influence insurer pricing strategies.
Understanding your state’s position helps set realistic expectations. Consider neighboring states if your operation allows flexibility, as crossing borders might yield significant savings.
Monthly vs. Annual Payment Structures
Payment structure significantly impacts total costs. Annual payments typically earn 10-15% discounts compared to monthly plans. On a $12,000 policy, this represents $1,200-$1,800 in savings.
Monthly payments provide cash flow flexibility but include financing charges. These fees, often unstated, increase your effective rate by 8-12%. For operations with steady revenue, annual payment usually proves more economical.
Some insurers offer quarterly or semi-annual options. These middle-ground approaches balance cash flow needs with reduced financing costs. Always calculate total annual cost when comparing payment options.
Hidden Fees and Additional Charges
Beyond base premiums, several fees can impact your total cost. Policy fees range from $50-$250 annually. Broker fees, if applicable, add another $100-$500. These charges rarely appear in initial quotes.
Filing fees for certificates and endorsements accumulate quickly. Each certificate might cost $25-$50, with some operations requiring dozens annually. Electronic filing systems reduce but don’t eliminate these costs.
Audit adjustments can surprise operators. If actual operations exceed initial projections, additional premiums become due. Accurate initial reporting prevents these unexpected costs and maintains insurer relationships.
Coverage Types and Their Impact on Rates
Primary Liability Requirements and Costs
Primary liability forms the foundation of commercial trucking insurance. Federal minimums start at $750,000 for general freight, but practical coverage often requires $1,000,000 or more. Each coverage level jump adds 15-25% to base premiums.
Many shippers and brokers demand higher limits through contractual requirements. Moving from $750,000 to $1,000,000 might add $2,000 annually, while reaching $2,000,000 could add another $3,000-$4,000.
The coverage pays for third-party injuries and property damage. Given potential verdict sizes, many operators view higher limits as essential protection despite increased costs.
Physical Damage Coverage Calculations
Physical damage premiums directly correlate with vehicle value. Insurers typically charge 3-5% of vehicle value annually for comprehensive coverage. A $100,000 truck might cost $3,000-$5,000 yearly to protect.
Deductible selection significantly impacts premiums. Moving from a $1,000 to $2,500 deductible might reduce premiums by 20-30%. However, ensure deductible levels remain affordable during claims.
Age affects physical damage rates dramatically. Trucks over ten years old might see limited coverage options or face substantially higher rates. Some insurers refuse physical damage coverage on older equipment entirely.
Cargo Insurance Premium Factors
Cargo coverage costs depend on commodity type, value, and volume. Basic coverage for general freight might cost $400-$800 annually per $100,000 in coverage. Specialized cargo commands higher rates.
Refrigerated goods, electronics, and pharmaceuticals face multiplied rates. A reefer operation might pay $1,500-$2,500 for the same coverage limits. Hazmat cargo can push costs even higher.
Deductibles for cargo claims typically start at $1,000 but can reach $5,000 or more. Higher deductibles provide premium relief but require careful consideration of typical claim values in your operation.
Umbrella and Excess Liability Pricing
Umbrella policies provide coverage above primary limits. These policies activate after primary coverage exhausts, providing crucial protection against catastrophic claims. Pricing typically runs $5,000-$7,000 per million in additional coverage.
The first million in umbrella coverage costs the most, with subsequent millions priced lower. This reflects the decreasing probability of extreme claims. A $5 million umbrella might cost less than double a $1 million policy.
Many operators view umbrella coverage as expensive until facing a major claim. With nuclear verdicts increasingly common, excess coverage provides essential asset protection for established operations.
Optional Coverage Cost-Benefit Analysis
Beyond mandatory coverage, several optional protections merit consideration:
Trailer Interchange Coverage: Costs $300-$800 annually but protects against damage to non-owned trailers. Essential for operators frequently using third-party equipment.
Bobtail Insurance: Runs $350-$480 yearly, covering non-dispatch driving. Owner-operators need this protection for personal use and deadhead miles.
Rental Reimbursement: Adds $200-$400 annually but provides crucial cash flow protection during vehicle repairs. Daily limits typically range from $75-$150.
Loading/Unloading Coverage: Extends liability protection during cargo handling. Costs $200-$500 yearly but prevents coverage gaps during common claim scenarios.
Federal and State Regulations Affecting Rates
FMCSA Minimum Requirements
The Federal Motor Carrier Safety Administration establishes baseline insurance requirements for interstate commerce. General freight requires $750,000 in primary liability, while specific commodities demand higher limits.
These minimums haven’t increased since the 1980s, despite inflation and rising claim costs. Many industry observers expect increases soon, which would dramatically impact base premium costs across the industry.
Current requirements vary by commodity:
- General Freight: $750,000
- Oil/Hazmat: $1,000,000
- Household Goods: $5,000,000
- Hazardous Materials: $5,000,000
State-Specific Mandates and Variations
Individual states impose additional requirements beyond federal minimums. California, for example, requires $750,000 for intrastate operations over 10,001 pounds. Texas mandates different limits based on vehicle weight and commodity.
Some states require additional coverage types. New York mandates no-fault coverage, adding cost and complexity. Workers’ compensation requirements vary dramatically, with some states requiring coverage for owner-operators while others exempt them.
Understanding your operating states’ requirements prevents compliance issues and accurate quote comparisons. Multi-state operations must meet each state’s requirements, typically defaulting to the highest mandates.
Hazmat and Specialized Cargo Rules
Hazardous material transport faces stringent insurance requirements. The $5,000,000 minimum represents just the starting point. Many shippers require additional coverage through contractual agreements.
Specialized endorsements add complexity and cost. Each hazmat class might require specific policy language and underwriting approval. Some insurers avoid hazmat entirely, limiting market options.
Beyond insurance, hazmat operations face additional costs for compliance, training, and equipment. These indirect costs impact overall operational economics and must factor into rate negotiations.
Compliance Impact on Premium Calculations
Regulatory compliance directly influences insurance pricing. Strong CSA scores can reduce premiums by 10-20%, while poor scores might make coverage unavailable at any price.
Safety ratings affect more than just availability. Conditional or unsatisfactory ratings trigger immediate rate increases, sometimes doubling premiums. Maintaining satisfactory ratings requires ongoing attention to:
- Hours of service compliance
- Vehicle maintenance records
- Driver qualification files
- Drug and alcohol testing programs
- Accident reporting procedures
Proactive compliance management represents one of the most effective rate reduction strategies available. Investment in compliance systems typically returns multiples through reduced insurance costs.
How Insurance Companies Evaluate Risk?
The Underwriting Process Decoded
Commercial truck underwriting involves multiple evaluation stages. Initial applications trigger automated scoring systems that assess basic eligibility. Qualifying applications advance to human underwriters for detailed analysis.
Underwriters examine dozens of data points beyond application information. They review public records, verify coverage history, and analyze industry databases. This comprehensive approach ensures accurate risk assessment and appropriate pricing.
The process typically takes 3-10 business days for standard risks. Complex operations or adverse history might require weeks of evaluation. Understanding this timeline helps manage expectations during insurance shopping.
Data Points Insurers Actually Use
Modern underwriters access extensive information sources:
Internal Data:
- Application details
- Prior claims history
- Payment patterns
- Policy modifications
External Sources:
- MVR reports for all drivers
- CSA scores and violations
- Credit reports
- Loss database searches
- Social media activity
This comprehensive data gathering explains why application accuracy matters. Discrepancies between provided and discovered information can void coverage or trigger immediate cancellation.
Automated vs. Manual Rating Systems
Insurance technology increasingly automates routine underwriting. Simple risks might receive instant quotes through online portals. These systems work well for standard operations with clean histories.
Complex risks still require human expertise. Manual underwriting considers nuances automated systems miss. Experienced underwriters might offer coverage where automated systems decline, though typically at higher rates.
The hybrid approach combines efficiency with expertise. Initial automated screening identifies straightforward risks, while edge cases receive personal attention. Understanding which category you fall into helps set shopping expectations.
Industry Loss Data and Benchmarking
Insurers continuously analyze industry-wide loss trends. They benchmark individual operations against peer groups with similar characteristics. Performance relative to peers influences individual pricing decisions.
Key benchmarking metrics include:
- Accident frequency per million miles
- Average claim severity by type
- Loss ratio compared to similar operations
- Safety technology adoption rates
- Driver turnover statistics
Operations outperforming their peer groups qualify for preferred pricing. Those underperforming face surcharges or coverage restrictions. Regular safety improvements can shift your position within these comparative frameworks.
Proven Strategies to Lower Your Insurance Rates
Immediate Actions for Rate Reduction
Several strategies can reduce your semi truck insurance costs immediately:
Increase Deductibles: Moving from $1,000 to $2,500 deductibles typically saves 15-25% on physical damage premiums. Ensure you can afford the higher out-of-pocket cost if claims occur.
Pay Annually: Take advantage of paid-in-full discounts ranging from 10-15%. On a $15,000 policy, this saves $1,500-$2,250 annually.
Bundle Coverages: Combining all policies with one insurer often yields 5-10% multi-policy discounts. This also simplifies administration and claims handling.
Review Coverage Limits: Evaluate whether current limits match actual needs. Reducing unnecessary coverage provides immediate savings without compromising essential protection.
Long-Term Premium Optimization Tactics
Sustainable rate reductions require strategic planning:
Safety Program Development: Formal safety programs demonstrating continuous improvement earn recognition from insurers. Document all training, meetings, and initiatives for underwriting credit.
Technology Investment: Installing approved safety devices provides both immediate discounts and long-term accident reduction. Calculate ROI including both premium savings and loss prevention.
Driver Selection: Implementing strict hiring criteria focusing on experience and clean records improves your overall risk profile. One bad hire can eliminate years of premium savings.
Preventive Maintenance: Documented maintenance programs reduce breakdown-related claims and demonstrate professional operations. Some insurers offer specific discounts for certified maintenance programs.
Discount Programs You’re Missing
Many operators overlook available discounts:
Association Memberships: Industry associations often negotiate group rates providing 5-15% savings. The cost of membership typically pays for itself through insurance savings alone.
Safety Certifications: Completing recognized safety programs like Smith System or NSC defensive driving qualifies for immediate discounts. Some insurers cover training costs through premium credits.
Experience Credits: Drivers with extensive claim-free experience might qualify for additional discounts. Document all commercial driving history, even from previous employers.
Equipment Discounts: Specific equipment features earn credits:
- Air disc brakes: 3-5%
- Collision mitigation: 8-10%
- Driver cameras: 10-15%
- Electronic logs: 2-3%
Technology Solutions That Cut Costs
Modern technology provides multiple paths to reduced premiums:
Telematics Programs: Usage-based insurance programs using telematics can save 5-20% for safe drivers. These programs monitor speed, harsh braking, and hours of service compliance.
Video Systems: Forward and driver-facing cameras provide claim protection and premium discounts. Some systems include real-time coaching features that prevent accidents before they occur.
Predictive Analytics: Advanced platforms predict accident risk based on driver behavior patterns. Addressing identified risks before accidents occur improves loss ratios and reduces premiums.
Progressive’s Smart Haul program exemplifies technology-driven savings, averaging $1,056 in annual discounts through ELD integration.
Strategic Coverage Adjustments
Optimizing coverage structure can significantly reduce costs without compromising protection:
Self-Insurance Options: Larger operations might benefit from higher deductibles or self-insured retentions. This transfers predictable small claims in-house while maintaining catastrophic protection.
Captive Insurance Programs: Groups of similar operators can form captives, sharing risk and retaining underwriting profits. This advanced strategy requires careful evaluation but can provide substantial long-term savings.
Coverage Timing: Adjusting coverage seasonally for seasonal operations prevents paying for unnecessary protection. Ensure proper coverage remains during any operational periods.
Common Mistakes That Increase Your Rates
Misclassification Errors
Incorrect classification of operations, vehicles, or cargo represents the most common and costly error. Insurers discovering misclassification can retroactively adjust premiums or deny claims entirely.
Common classification mistakes include:
- Understating operating radius
- Misrepresenting cargo types
- Incorrect vehicle classifications
- Failing to disclose all drivers
Accurate classification ensures appropriate coverage and pricing. When in doubt, over-disclose rather than risk coverage gaps or claim denials.
Coverage Gaps and Overlaps
Poor policy coordination creates both gaps and unnecessary overlaps. Gaps leave you exposed to uncovered claims, while overlaps waste money on redundant protection.
Typical problem areas include:
- Loading/unloading coverage boundaries
- Non-owned trailer protection
- Deadhead mile coverage
- Cargo custody transitions
Annual coverage reviews with experienced agents identify and eliminate these issues. The cost of professional review pays for itself through optimized coverage structure.
Renewal Timing Mistakes
Poor renewal timing costs thousands in missed opportunities. Starting renewal discussions 30 days before expiration limits options and negotiating power. Best practices suggest beginning 90-120 days early.
Early renewal shopping allows:
- Multiple quote comparisons
- Time for safety improvements
- Loss run corrections
- Application optimization
Rushed renewals often result in accepting unfavorable terms or missing available discounts. Calendar reminders ensure adequate shopping time.
Documentation Failures
Inadequate documentation undermines rate negotiations and claim settlements. Missing or poor records suggest operational deficiencies to underwriters, triggering higher rates or coverage restrictions.
Critical documentation includes:
- Driver qualification files
- Vehicle maintenance records
- Safety meeting minutes
- Training certificates
- Incident investigations
Systematic record-keeping demonstrates professionalism and reduces rates. Digital systems simplify organization and provide easy underwriter access during applications.
Insurance Shopping Best Practices
When to Get Multiple Quotes?
Strategic quote timing maximizes savings opportunities:
Annual Shopping: Even with satisfactory current coverage, annual shopping ensures competitive pricing. Markets change, and your improved risk profile might qualify for better rates.
Post-Improvement Shopping: After implementing safety improvements or reaching milestone anniversaries, fresh quotes capture enhanced positioning. Don’t wait for renewal to monetize improvements.
Market Disruption Events: Industry upheavals, carrier exits, or regulatory changes create shopping opportunities. Stay informed about market conditions affecting pricing.
Growth Milestones: Adding trucks, expanding territories, or changing operations necessitates fresh evaluation. Your current carrier might not offer optimal terms for evolved operations.
Questions to Ask Insurance Agents
Effective agent interactions require asking the right questions:
Coverage Questions:
- What specific exclusions apply to my operation?
- How do claims affect future premiums?
- What additional discounts might I qualify for?
- Which carriers specialize in my operation type?
Service Questions:
- What’s your typical claims response time?
- Do you provide risk management services?
- How do you handle certificate requests?
- What’s your carrier appointment history?
Cost Questions:
- Are there any fees beyond quoted premiums?
- How do payment plans affect total cost?
- What triggers mid-term premium adjustments?
- Can you provide loss run analysis?
Comparing Apples to Apples
Accurate quote comparison requires careful attention to coverage details. Premium alone doesn’t indicate value without understanding coverage scope. Create standardized comparison sheets documenting:
- Coverage limits by type
- Deductible amounts
- Excluded operations
- Additional fees
- Payment terms
- Carrier ratings
Request specimen policies when possible. Policy language varies between carriers, and exclusions hidden in definitions can create dangerous gaps.
Red Flags to Avoid
Certain warning signs indicate potentially problematic coverage:
Carrier Red Flags:
- Unusually low premiums (often indicate coverage gaps)
- Poor financial ratings (below B+)
- Limited trucking experience
- Frequent underwriting changes
- High complaint ratios
Agent Red Flags:
- Pressure for immediate decisions
- Unwillingness to explain coverage
- Limited carrier access
- No risk management services
- Poor communication responsiveness
Trust your instincts when something seems wrong. The cheapest option rarely provides the best value, and coverage gaps can bankrupt operations.
Future Trends in Commercial Truck Insurance Pricing
Technology’s Impact on Rates
Emerging technologies promise continued rate evolution. Artificial intelligence increasingly drives underwriting decisions, potentially reducing human bias while improving risk assessment accuracy.
Autonomous vehicle technology, though years from widespread adoption, already influences planning. Insurers invest heavily in understanding liability shifts and coverage needs for mixed human/autonomous fleets.
Blockchain technology might revolutionize policy administration and claims processing. Smart contracts could automate coverage adjustments and claims payments, reducing administrative costs and fraud.
Market Predictions for 2026 and Beyond
Industry experts anticipate several key trends:
Rate Environment: After years of increases, commercial trucking insurance rates show stabilization signs. Improved safety technology and better data analytics help control loss costs.
Coverage Evolution: Traditional coverage boundaries blur as technology changes risk profiles. Cyber coverage becomes increasingly important as trucks become rolling data centers.
Carrier Consolidation: Smaller insurers struggle with technology investments and catastrophic losses. Expect continued consolidation, potentially reducing market options but improving survivor stability.
Alternative Risk Transfer: More operators explore captives, risk retention groups, and parametric insurance. These alternatives provide coverage flexibility and potential cost savings.
Regulatory Changes on the Horizon
Several regulatory initiatives could impact future pricing:
Minimum Limit Increases: Proposed federal minimum increases from $750,000 to $2,000,000 would dramatically impact base premiums. While timeline remains uncertain, eventual increases seem likely.
Safety Technology Mandates: Potential requirements for automatic emergency braking and electronic stability control could increase equipment costs but reduce accident frequency.
Hours of Service Evolution: Continued HOS refinements might impact accident patterns and corresponding insurance rates. Greater flexibility could improve driver retention and safety.
Environmental Regulations: Electric and alternative fuel vehicle mandates create new risk profiles requiring updated coverage approaches and pricing models.
Frequently Asked Questions
Why is commercial truck insurance so expensive compared to regular auto insurance?
Commercial trucks pose exponentially higher risks than personal vehicles. A fully loaded semi can weigh 80,000 pounds, compared to 4,000 for a typical car. This mass difference means truck accidents cause substantially more damage and injuries.
Additionally, commercial operations involve professional liability beyond simple accident coverage. The potential for cargo damage, environmental cleanup, and business interruption claims adds coverage complexity. Nuclear verdicts exceeding $10 million have become increasingly common in truck accident cases.
Finally, trucks operate more miles annually than personal vehicles, increasing exposure to accidents. Professional drivers might log 100,000+ miles yearly, versus 12,000 for personal vehicles. This increased exposure multiplies risk and corresponding premiums.
How often do commercial truck insurance rates change?
Insurance rates fluctuate based on multiple factors, creating a dynamic pricing environment. Most carriers review and adjust base rates quarterly, responding to loss trends and market conditions. Your individual rates might change more frequently based on specific circumstances.
Annual renewals provide the most common adjustment point. Insurers reassess your risk profile, incorporating updated loss runs, safety scores, and operational changes. Mid-term adjustments can occur for significant changes like adding vehicles or expanding territories.
Market cycles also influence rate timing. Hard markets see frequent increases, while soft markets might offer stability or decreases. Understanding current market conditions helps anticipate rate directions and optimize shopping timing.
Can I reduce rates by limiting my operating radius?
Yes, restricting operating radius typically reduces insurance premiums by 20-40%. Local operations under 100 miles face fewer risks than regional or long-haul operations. Shorter distances mean less fatigue, familiar routes, and nightly home time.
However, radius restrictions must reflect actual operations. Insurers verify compliance through ELD data and claim locations. Operating outside stated radius can void coverage or trigger claim denials.
Consider radius carefully during application. While tighter restrictions save money, they limit business flexibility. Some operators maintain dual policies, with different trucks designated for different radius classifications.
Does the age of my truck significantly impact rates?
Vehicle age substantially affects insurance costs, particularly for physical damage coverage. Newer trucks cost more to repair or replace, increasing comprehensive and collision premiums. However, newer vehicles often include safety technology that reduces liability rates.
The sweet spot typically falls between 3-7 years old. These trucks avoid new vehicle premiums while maintaining modern safety features. Trucks over 10 years might face coverage restrictions or substantially higher rates.
Some insurers refuse physical damage coverage on trucks over 15 years old. Others might offer actual cash value coverage only, potentially leaving gaps between coverage and replacement costs. Balance equipment age with coverage needs and availability.
What’s the difference between owner-operator and fleet insurance rates?
Fleet insurance typically offers per-unit savings compared to single-truck policies. Economies of scale allow insurers to spread risk across multiple vehicles, reducing individual truck costs by 10-20%. Fleets also demonstrate operational sophistication that insurers reward.
Owner-operators face higher per-truck costs but simpler administration. They lack negotiating leverage and risk-spreading benefits of larger operations. However, owner-operators can sometimes access group programs through associations or lease agreements.
The transition from owner-operator to fleet status (typically at 3-5 trucks) provides opportunity for rate renegotiation. This milestone demonstrates business stability and growth that insurers value. Professional guidance during this transition ensures capturing available savings.
Conclusion
Understanding how commercial truck insurance rates are calculated empowers you to take control of this major operating expense. The complex interplay of risk factors, from your operating authority and vehicle type to safety technology and geographic location, determines whether you pay $3,000 or $22,000 annually.
The key takeaway is that most rate factors remain within your control. Strategic decisions about safety technology, driver hiring, and operational practices can reduce premiums by 30% or more. Even simple changes like increasing deductibles or paying annually provide immediate savings.
Take action today by requesting a comprehensive rate analysis from qualified trucking insurance specialists. Armed with the knowledge from this guide, you can ask the right questions, avoid common mistakes, and negotiate from a position of strength. Your bottom line will thank you.